

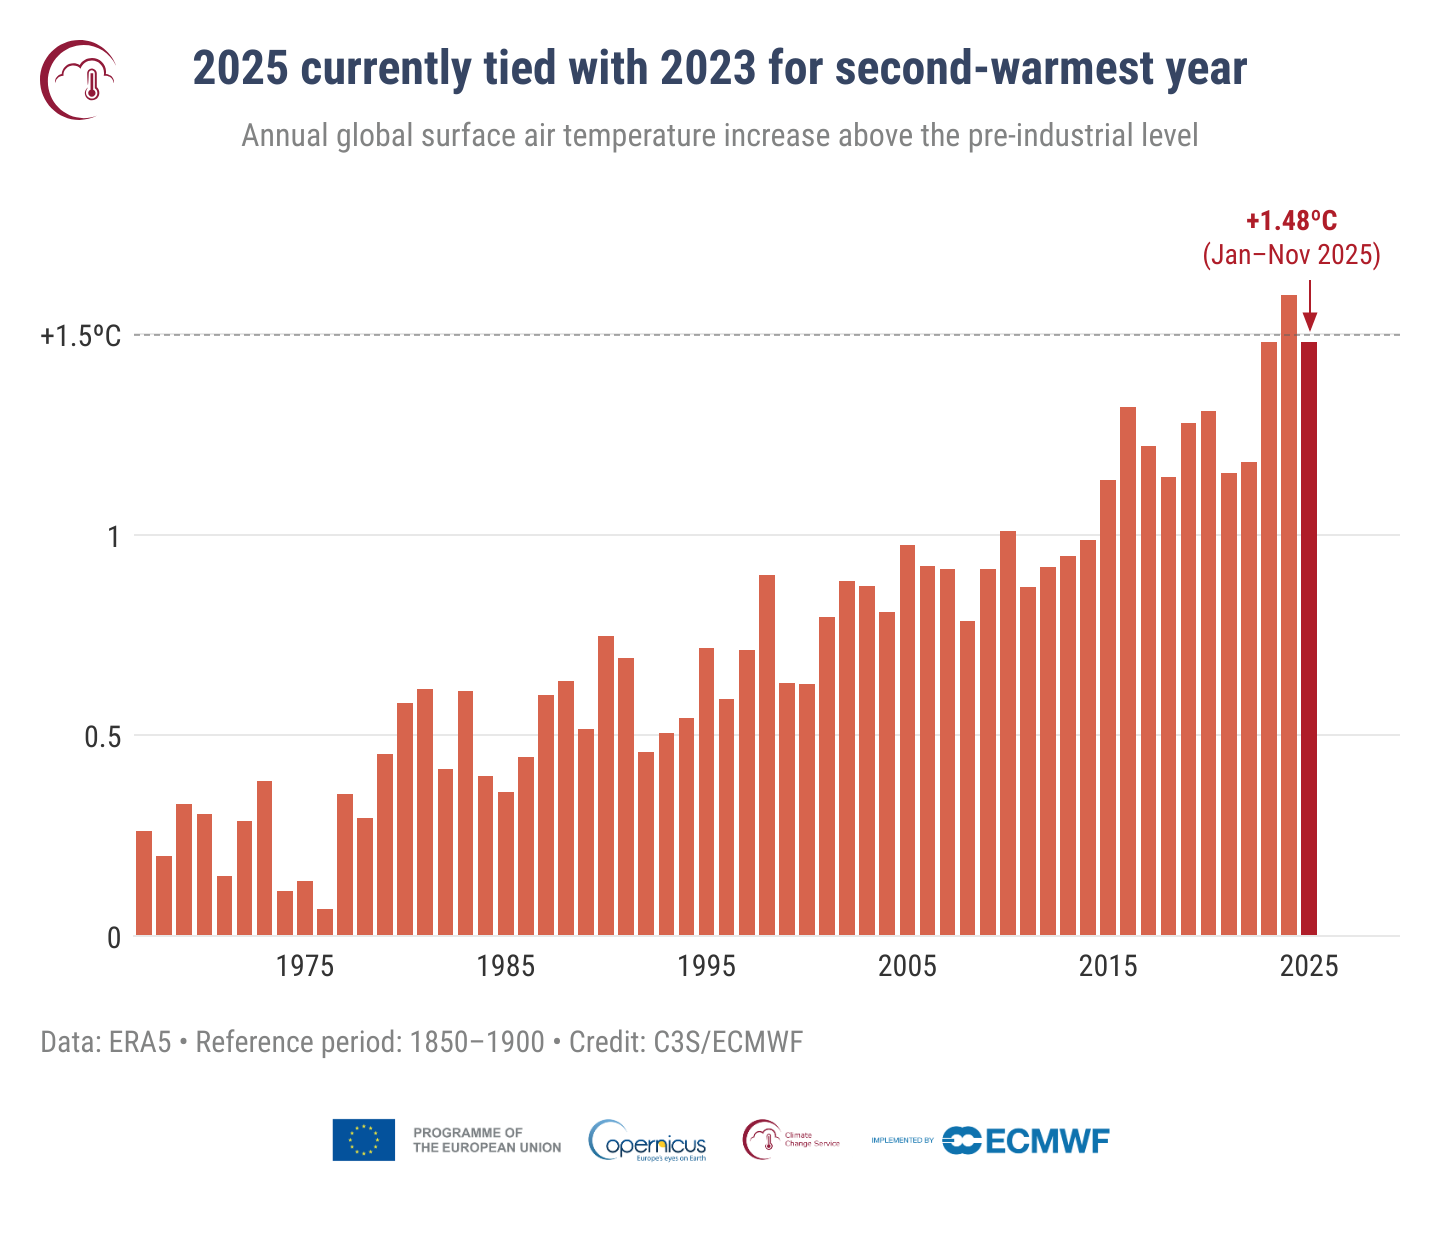
2025 is currently tied with 2023 to be the second-warmest year on record, according to new data from the Copernicus Climate Change Service (C3S).
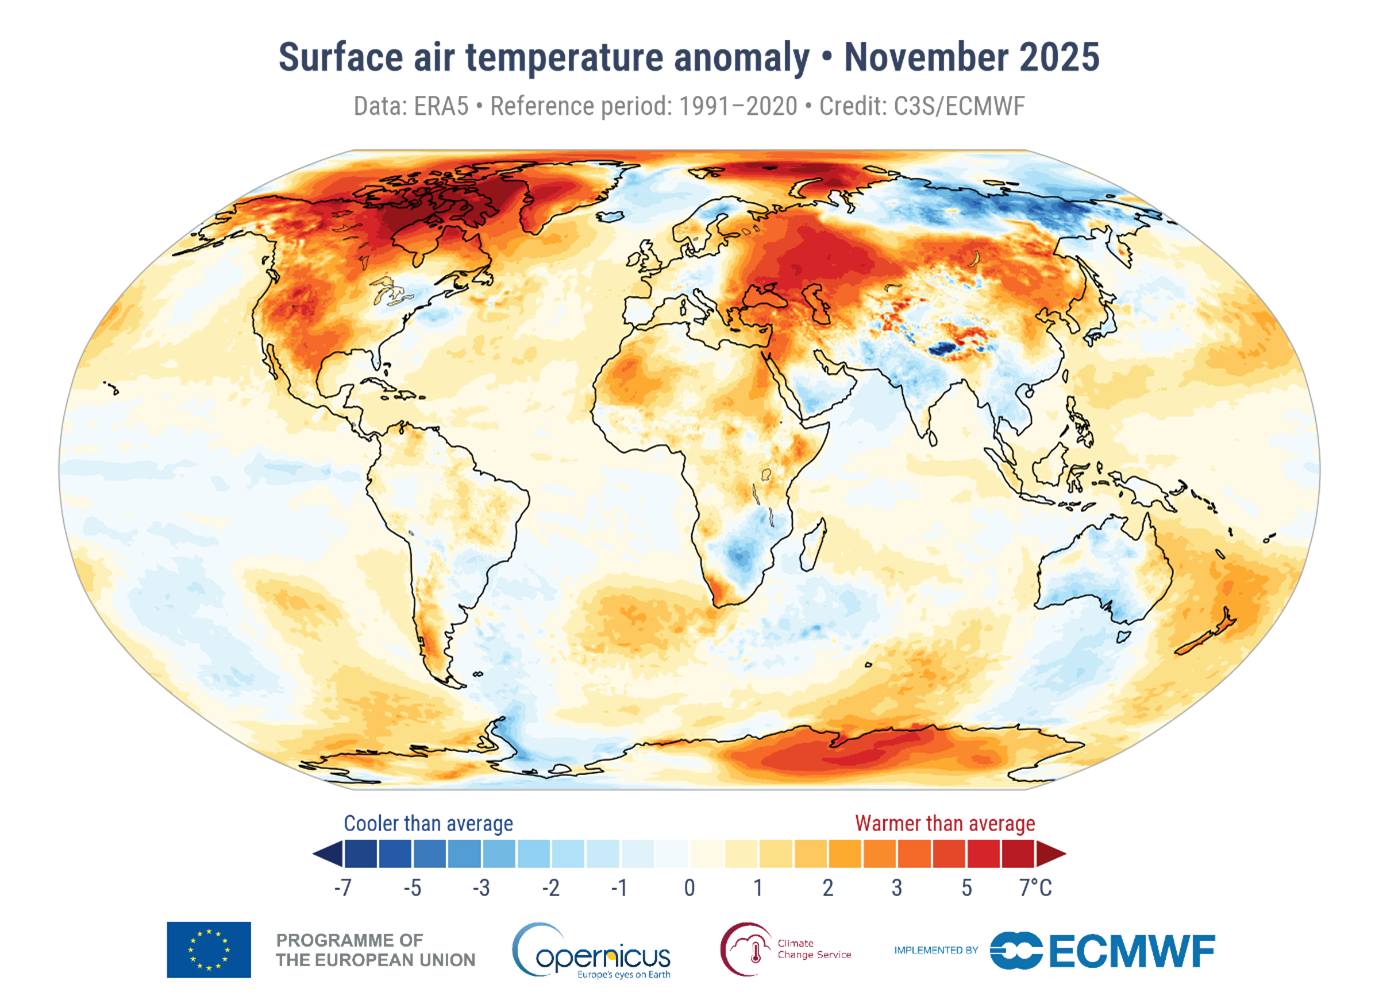
This monthly climate update also reveals November 2025 was the third-warmest globally, with warmer-than-average temperatures recorded across Northern Canada and the Arctic Ocean.
The month was marked by a number of extreme weather events, including tropical cyclones in Southeast Asia, causing widespread, catastrophic flooding, and loss of life.
Samantha Burgess, strategic lead for climate at C3S, commented: “For November, global temperatures were 1.54°C above pre-industrial levels, and the three-year average for 2023–2025 is on track to exceed 1.5°C for the first time.
“These milestones are not abstract – they reflect the accelerating pace of climate change and the only way to mitigate future rising temperatures is to rapidly reduce greenhouse gas emissions.”
November 2025
November 2025 was the third-warmest November globally, with an average surface air temperature of 14.02°C, 0.65°C above the 1991-2020 average for November, according to the ERA5 dataset.
Last month was marginally cooler (0.20°C) than the warmest November on record, in 2023, and 0.08°C cooler than the second warmest, in 2024.
According to C3C, 2025 is virtually certain to finish as the second- or third-warmest year on record, possibly tied with 2023, the current second-warmest year, and behind 2024, the warmest year on record.
While 2025 may not reach 1.5°C above the pre-industrial level, the average global temperature for 2023–2025 is likely to exceed 1.5°C, which would be the first three-year average to do so in the instrumental period, according to the ERA5 dataset.
September to November
The global-average temperature for the boreal autumn 2025 (September to November) was the third highest on record, at 0.67°C above the 1991-2020 average, and cooler only than the boreal autumns of 2023 and 2024.
Temperatures were mostly above average across the world, especially in northern Canada, over the Arctic Ocean, and across Antarctica.
Mixed conditions occurred across southern Asia, while notable cold anomalies were experienced in north-eastern Russia.
The average temperature over European land for November 2025 was 5.74°C, which was 1.38°C above the 1991-2020 average for November, making it the fifth-warmest November.
Europe had its fourth-warmest autumn season on record this year, at 1.06°C above the 1991-2020 average.
Sea surface temperatures
The average sea surface temperature (SST) for November 2025 over 60°S–60°N was 20.42°C.
This was the fourth-highest value on record for the month, and 0.29°C below the November 2023 record.
Most of the North Pacific continued to experience much above-average SSTs, with record highs in the west.
Rain in November and autumn
November 2025 was wetter than average across the UK, Ireland, Portugal, Spain, north-western Russia and much of the Balkans, with particularly heavy rainfall in Albania and Greece, according to the report.
Storm Claudia contributed to widespread wet conditions in western Europe.
Drier-than-average conditions were seen in Iceland, southern Spain, northern Italy, central Germany and Sweden, while drought warnings persisted across south-eastern Europe, particularly in south-western Russia, Ukraine, and Turkey.
Autumn 2025 was wetter than average across Ireland and the UK, much of Scandinavia, the western Iberian Peninsula and south-east Spain, as well as central Europe.
Copernicus Climate Change Service
C3S is implemented by the European Centre for Medium-Range Weather Forecasts on behalf of the European Commission with funding from the EU.
It routinely publishes monthly climate bulletins reporting on the changes observed in global surface air and sea temperatures, sea ice cover and hydrological variables.
Most of the reported findings are based on the ERA5 re-analysis dataset, using billions of measurements from satellites, ships, aircraft, and weather stations around the world.
