Carbon intensity indicators for Northern Ireland have been published by the Department of Agriculture, Environment and Rural Affairs (DAERA). Northern Ireland Carbon Intensity Indicators 2021 - the sixth such instalment - reveal the progress being made in NI towards reducing greenhouse emissions (GHG) in terms of intensity as opposed to absolute emissions.

Agriculture

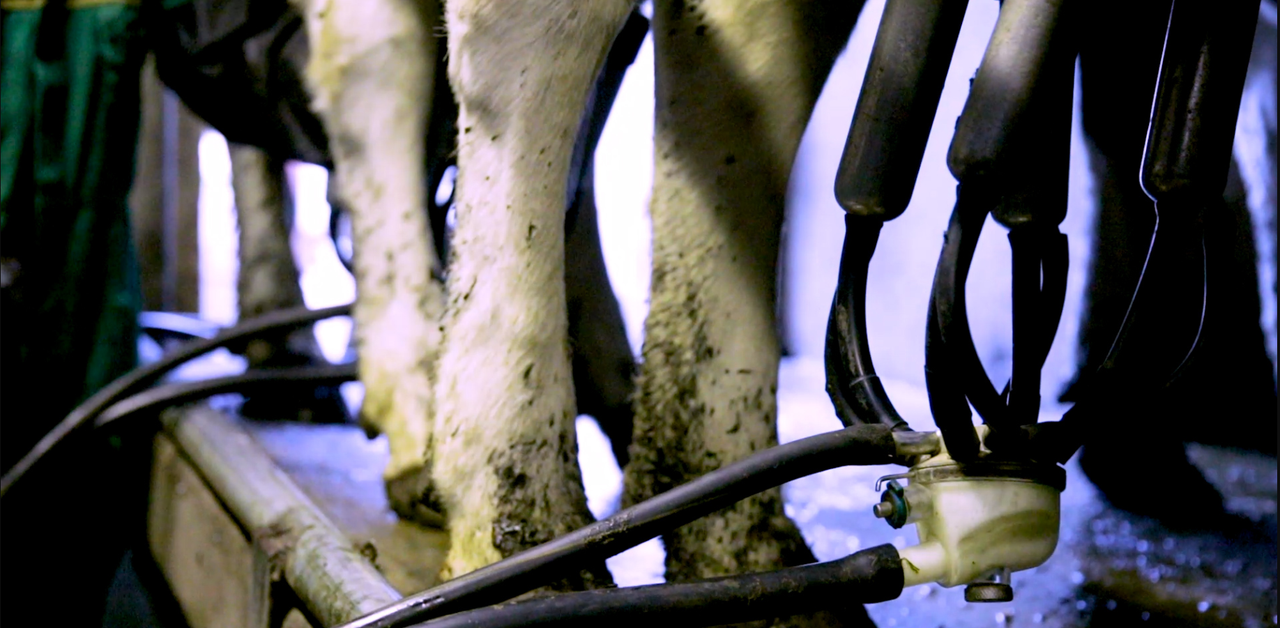
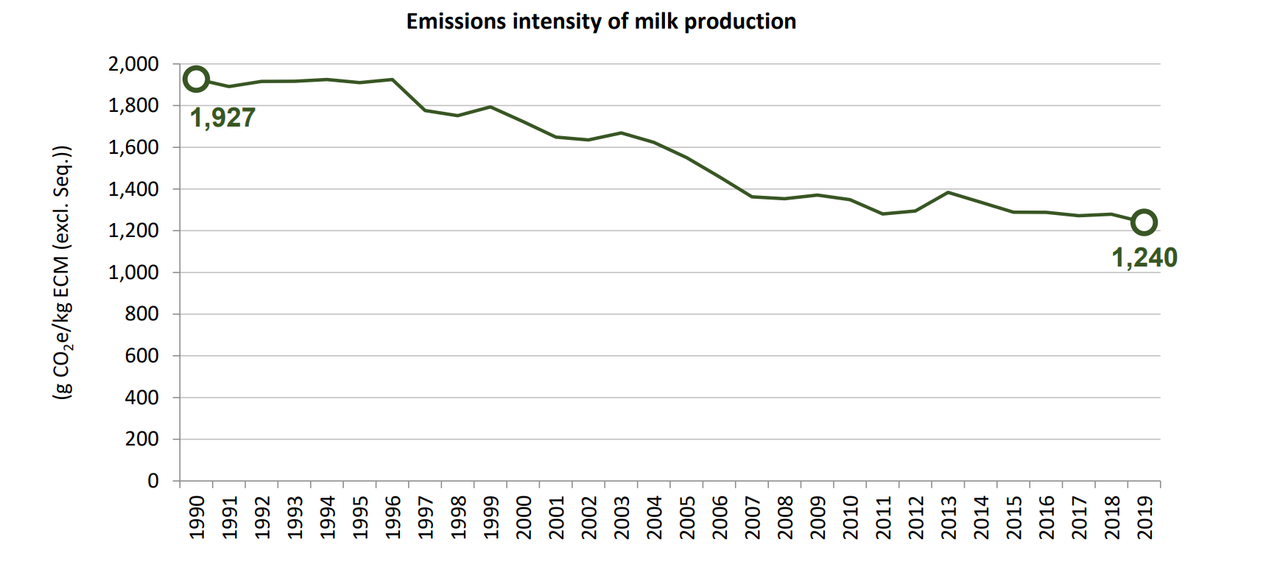
In terms of agriculture in Northern Ireland, the indicators reveal that total emissions (excluding sequestration) related to milk production decreased from a population average of 1,927g of CO2 equivalent per kilogramme in 1990 to 1,240g in 2019.

While milk production in the dairy sector has expanded by 81% since 1990, the total number of dairy cows over this period has increased by only 13%.

Emissions intensity of milk production. Image source: DAERA
This means that the improvement in carbon footprint has been driven by substantial increases in milk yield per cow, according to the report.

Carbon intensity - what is this?

While overall emissions might be seen to be increasing for a particular sector in line with an expanding economy, the carbon intensity might actually be decreasing, which could still be viewed as a positive outcome. The carbon intensity indicators are another way of measuring the progress being made in NI towards reducing GHG emissions - in terms of intensity rather than absolute emissions.

Some of the main findings

  • Gross Value Added (GVA) is used to measure NI's economic output. Since 1998 it has grown substantially, while GHG emissions have declined. The ratio of total GHG emissions to GVA, in NI, decreased by 62% from 1998 to 2019.
  • In 2019, GHG emissions intensity for NI was estimated at around 0.51kg of carbon dioxide (CO2) equivalent per £ of GVA. In 1998, this figure stood at 1.34kg.
  • GHG emissions per capita decreased 31% from 16.3t CO2 equivalent in 1990 to 11.3t in 2019. The population increased by 19% over this period, while GHG emissions decreased by 18%.
  • GHG emissions per unit of electricity generated decreased 48% from 631g CO2 equivalent per kWh in 2004 to 330g in 2019. This has been driven by the growth of renewable generation in NI, a shift away from coal use towards gas for electricity generation, and improvements in energy efficiency.
  • Residential GHG emissions per household have decreased 4% from 3.78t of CO2 equivalent per household in 2008 to 3.63t in 2019. Fuel switching to natural gas from more carbon-intensive fuels such as coal and oil has reduced emissions, but more households create greater demand for energy.
  • Road transport emissions per vehicle kilometre travelled decreased 11% from 244g of CO2 equivalent per vehicle kilometre travelled in 2008 to 218 in 2019.
  • Waste management emissions per capita have decreased 66% from 1,135kg of CO2 equivalent per person in 1990 to 385kg in 2019. The population increased by 19% over this period while GHG emissions from waste management have fallen by 60%, due in a large part to the introduction of methane capture and oxidation systems at landfill sites.